
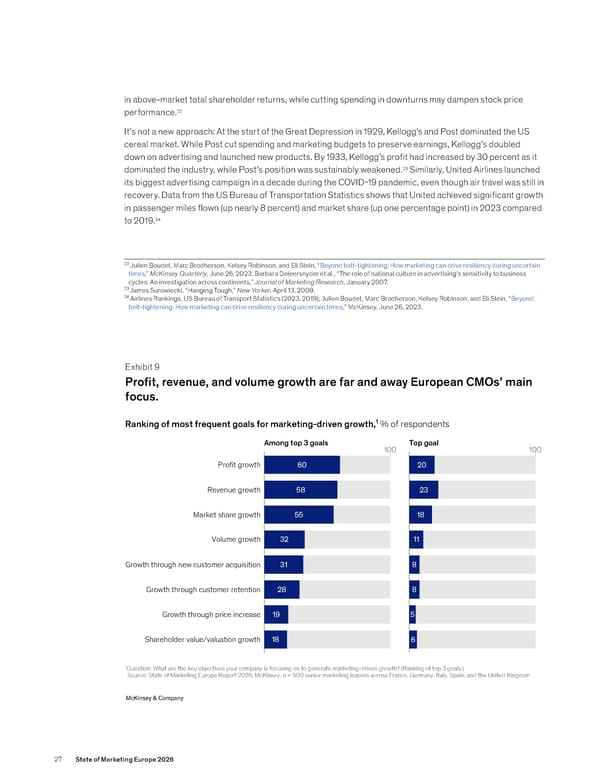
in above-market total shareholder returns, while cutting spending in downturns may dampen stock price performance. 22 It’s not a new approach: At the start of the Great Depression in 1929, Kellogg’s and Post dominated the US cereal market. While Post cut spending and marketing budgets to preserve earnings, Kellogg’s doubled down on advertising and launched new products. By 1933, Kellogg’s profit had increased by 30 percent as it dominated the industry, while Post’s position was sustainably weakened. 23 Similarly, United Airlines launched its biggest advertising campaign in a decade during the COVID-19 pandemic, even though air travel was still in recovery. Data from the US Bureau of Transportation Statistics shows that United achieved significant growth in passenger miles flown (up nearly 8 percent) and market share (up one percentage point) in 2023 compared to 2019. 24 22 Julien Boudet, Marc Brodherson, Kelsey Robinson, and Eli Stein, “Beyond belt-tightening: How marketing can drive resiliency during uncertain times,” McKinsey Quarterly , June 26, 2023; Barbara Deleersnyder et al., “The role of national culture in advertising’s sensitivity to business cycles: An investigation across continents,” Journal of Marketing Research , January 2007. 23 James Surowiecki, “Hanging Tough,” New Yorker, April 13, 2009. 24 Airlines Rankings, US Bureau of Transport Statistics (2023, 2019); Julien Boudet, Marc Brodherson, Kelsey Robinson, and Eli Stein, “Beyond belt-tightening: How marketing can drive resiliency during uncertain times,” McKinsey, June 26, 2023. Exhibit 9 Ranking of most frequent goals for marketing-driven growth,¹ % of respondents 1 Question: What are the key objectives your company is focusing on to generate marketing-driven growth? (Ranking of top 3 goals.) Source: State of Marketing Europe Report 2026, McKinsey, n = 500 senior marketing leaders across France, Germany, Italy, Spain, and the United Kingdom Profit, revenue, and volume growth are far and away European CMOs’ main focus. McKinsey & Company Among top 3 goals Top goal 100 100 Profit growth Revenue growth Market share growth Growth through new customer acquisition Volume growth Growth through customer retention Growth through price increase Shareholder value/valuation growth 60 58 55 31 32 28 19 18 20 23 18 8 11 8 5 6 27 State of Marketing Europe 2026
 State of Marketing Europe 2026 Page 28 Page 30